OpenTelemetry LLM analytics installation
Contents
- 1
Install dependencies
RequiredFull working examplesInstall the OpenTelemetry SDK, PostHog's OpenTelemetry helper, and an OpenTelemetry instrumentation for the provider you want to trace. The examples below use the OpenAI instrumentation, but any library that emits
gen_ai.*spans will work. - 2
Set up OpenTelemetry tracing
RequiredConfigure OpenTelemetry to export spans to PostHog via the
PostHogSpanProcessor. The processor only forwards AI-related spans — spans whose name or attribute keys start withgen_ai.,llm.,ai., ortraceloop.— and drops everything else. PostHog convertsgen_ai.*spans into$ai_generationevents automatically.PostHog identifies each event using the
posthog.distinct_idattribute on the OpenTelemetry Resource (withuser.idas a fallback, then a random UUID if neither is set). Because the Resource applies to every span in a batched export, you only need to set the distinct ID once — there's no need for aBaggageSpanProcessoror per-span propagation. Any other Resource or span attributes pass through as event properties. - 3
Make an LLM call
RequiredWith the processor and instrumentation wired up, any LLM call made through the instrumented SDK is captured. PostHog receives the emitted
gen_ai.*span and converts it into an$ai_generationevent.Note: If you want to capture LLM events anonymously, omit the
posthog.distinct_idresource attribute. See our docs on anonymous vs identified events to learn more.You can expect captured
$ai_generationevents to have the following properties:Property Description $ai_modelThe specific model, like gpt-5-miniorclaude-4-sonnet$ai_latencyThe latency of the LLM call in seconds $ai_time_to_first_tokenTime to first token in seconds (streaming only) $ai_toolsTools and functions available to the LLM $ai_inputList of messages sent to the LLM $ai_input_tokensThe number of tokens in the input (often found in response.usage) $ai_output_choicesList of response choices from the LLM $ai_output_tokensThe number of tokens in the output (often found in response.usage)$ai_total_cost_usdThe total cost in USD (input + output) [...] See full list of properties - 4
How attributes map to event properties
RecommendedPostHog translates standard OpenTelemetry GenAI semantic convention attributes into the same
$ai_*event properties our native SDK wrappers emit, so traces look the same in PostHog whether they arrive through OpenTelemetry or a native wrapper. The most common mappings:OpenTelemetry attribute PostHog event property gen_ai.response.model(orgen_ai.request.model)$ai_modelgen_ai.provider.name(orgen_ai.system)$ai_providergen_ai.input.messages$ai_inputgen_ai.output.messages$ai_output_choicesgen_ai.usage.input_tokens(orgen_ai.usage.prompt_tokens)$ai_input_tokensgen_ai.usage.output_tokens(orgen_ai.usage.completion_tokens)$ai_output_tokensserver.address$ai_base_urltelemetry.sdk.name/telemetry.sdk.version$ai_lib/$ai_lib_versionSpan start/end timestamps $ai_latency(computed in seconds)Span name $ai_span_nameAdditional behavior worth knowing:
- Custom attributes pass through. Any Resource or span attribute that isn't part of the known mapping is forwarded onto the event as-is, so you can add dimensions like
conversation_idortenant_idand filter on them in PostHog. - Trace and span IDs are preserved as
$ai_trace_id,$ai_span_id, and$ai_parent_id, so multi-step traces reconstruct correctly. - Events are classified by operation.
gen_ai.operation.name=chatbecomes an$ai_generationevent;embeddingsbecomes$ai_embedding. Spans without a recognized operation become$ai_span(or$ai_traceif they're the root of a trace). - Vercel AI SDK, Pydantic AI, and Traceloop/OpenLLMetry emit their own namespaces (
ai.*,pydantic_ai.*,traceloop.*) and PostHog normalizes those to the same$ai_*properties. - Noisy resource attributes are dropped. OpenTelemetry auto-detected attributes under
host.*,process.*,os.*, andtelemetry.*(excepttelemetry.sdk.name/telemetry.sdk.version) don't pollute event properties.
- Custom attributes pass through. Any Resource or span attribute that isn't part of the known mapping is forwarded onto the event as-is, so you can add dimensions like
- 5
Other instrumentations, direct OTLP, and troubleshooting
OptionalAlternative instrumentation libraries. Any library that emits standard
gen_ai.*spans (orai.*/traceloop.*/pydantic_ai.*) works with the setup above. Swap@opentelemetry/instrumentation-openai/opentelemetry-instrumentation-openai-v2for one of these to broaden provider coverage:- OpenLIT — single instrumentation that covers many providers, vector DBs, and frameworks.
- OpenLLMetry (Traceloop) — broad provider and framework support in Python and JavaScript.
- OpenInference (Arize) — provider- and framework-specific instrumentations for Python and JavaScript.
- MLflow tracing — if you already run MLflow.
Direct OTLP export. If you run an OpenTelemetry Collector, or want to export from a language that isn't Python or Node.js, point any OTLP/HTTP exporter directly at PostHog's AI ingestion endpoint. PostHog accepts OTLP over HTTP in both
application/x-protobufandapplication/json, authenticated with aBearertoken. The endpoint is signal-specific (traces only), so use theOTEL_EXPORTER_OTLP_TRACES_*variants rather than the generalOTEL_EXPORTER_OTLP_*ones (the SDK appends/v1/tracesto the latter and would 404).Limits and troubleshooting.
- Only AI spans are ingested. Spans whose name and attribute keys don't start with
gen_ai.,llm.,ai., ortraceloop.are dropped server-side, so it's safe to send a mixed trace stream. - HTTP only, no gRPC. The endpoint speaks OTLP over HTTP in either
application/x-protobuforapplication/json. If your collector or SDK is configured for gRPC, switch to HTTP. - Request body is capped at 4 MB. Large or unbounded traces (for example, long chat histories with base64-encoded images) can exceed this. Use a collector with the
batchprocessor to keep individual exports small. - Missing traces? Make sure you're pointing at the traces-specific OTLP variable (
OTEL_EXPORTER_OTLP_TRACES_ENDPOINT/traces_endpoint) rather than the general one, and that your project token is set correctly in theAuthorization: Bearerheader.
- 6
Next steps
RecommendedNow that you're capturing AI conversations, continue with the resources below to learn what else LLM Analytics enables within the PostHog platform.
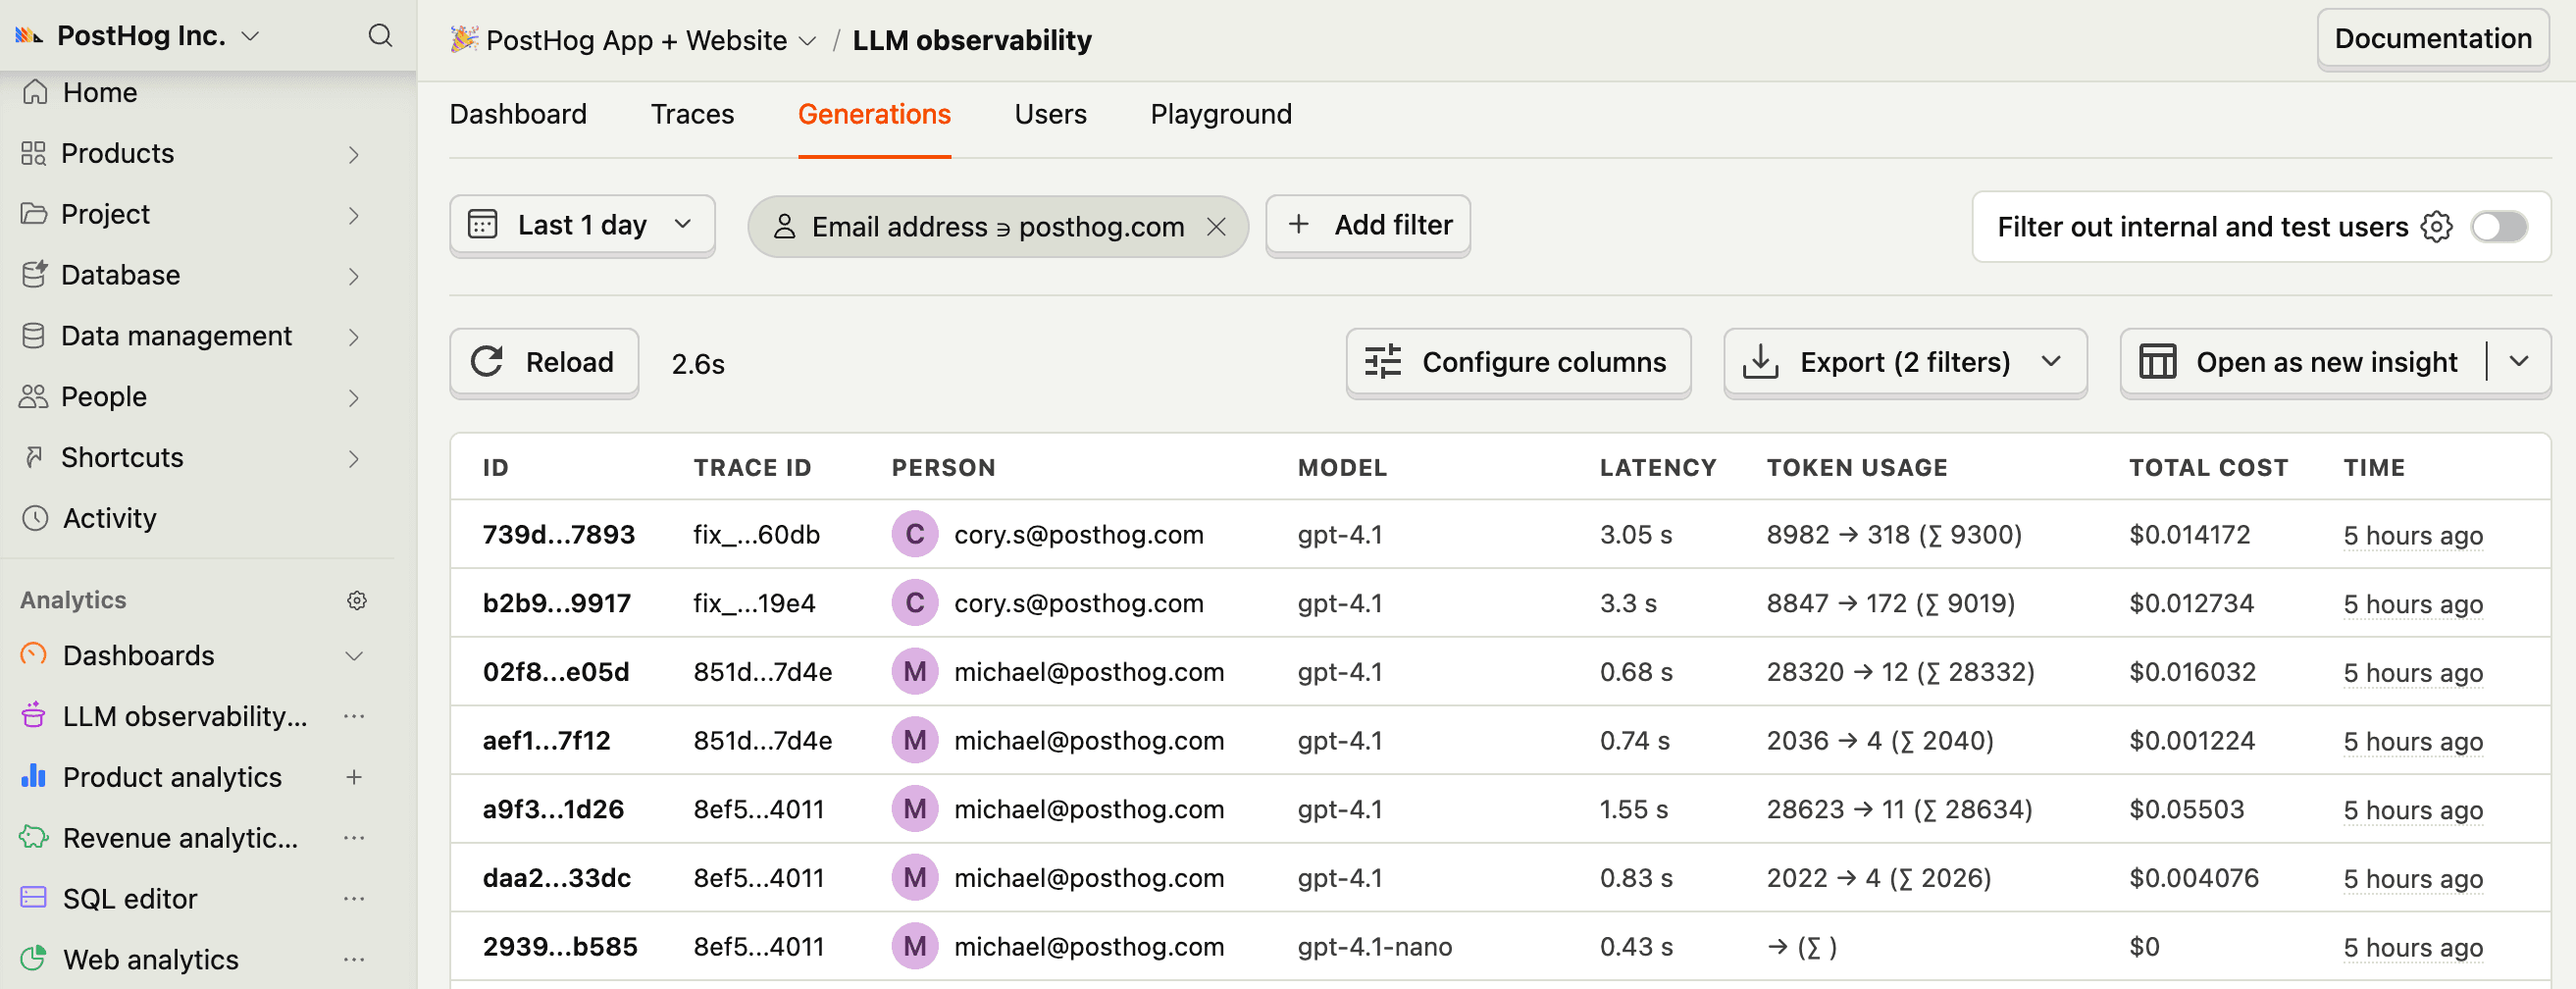
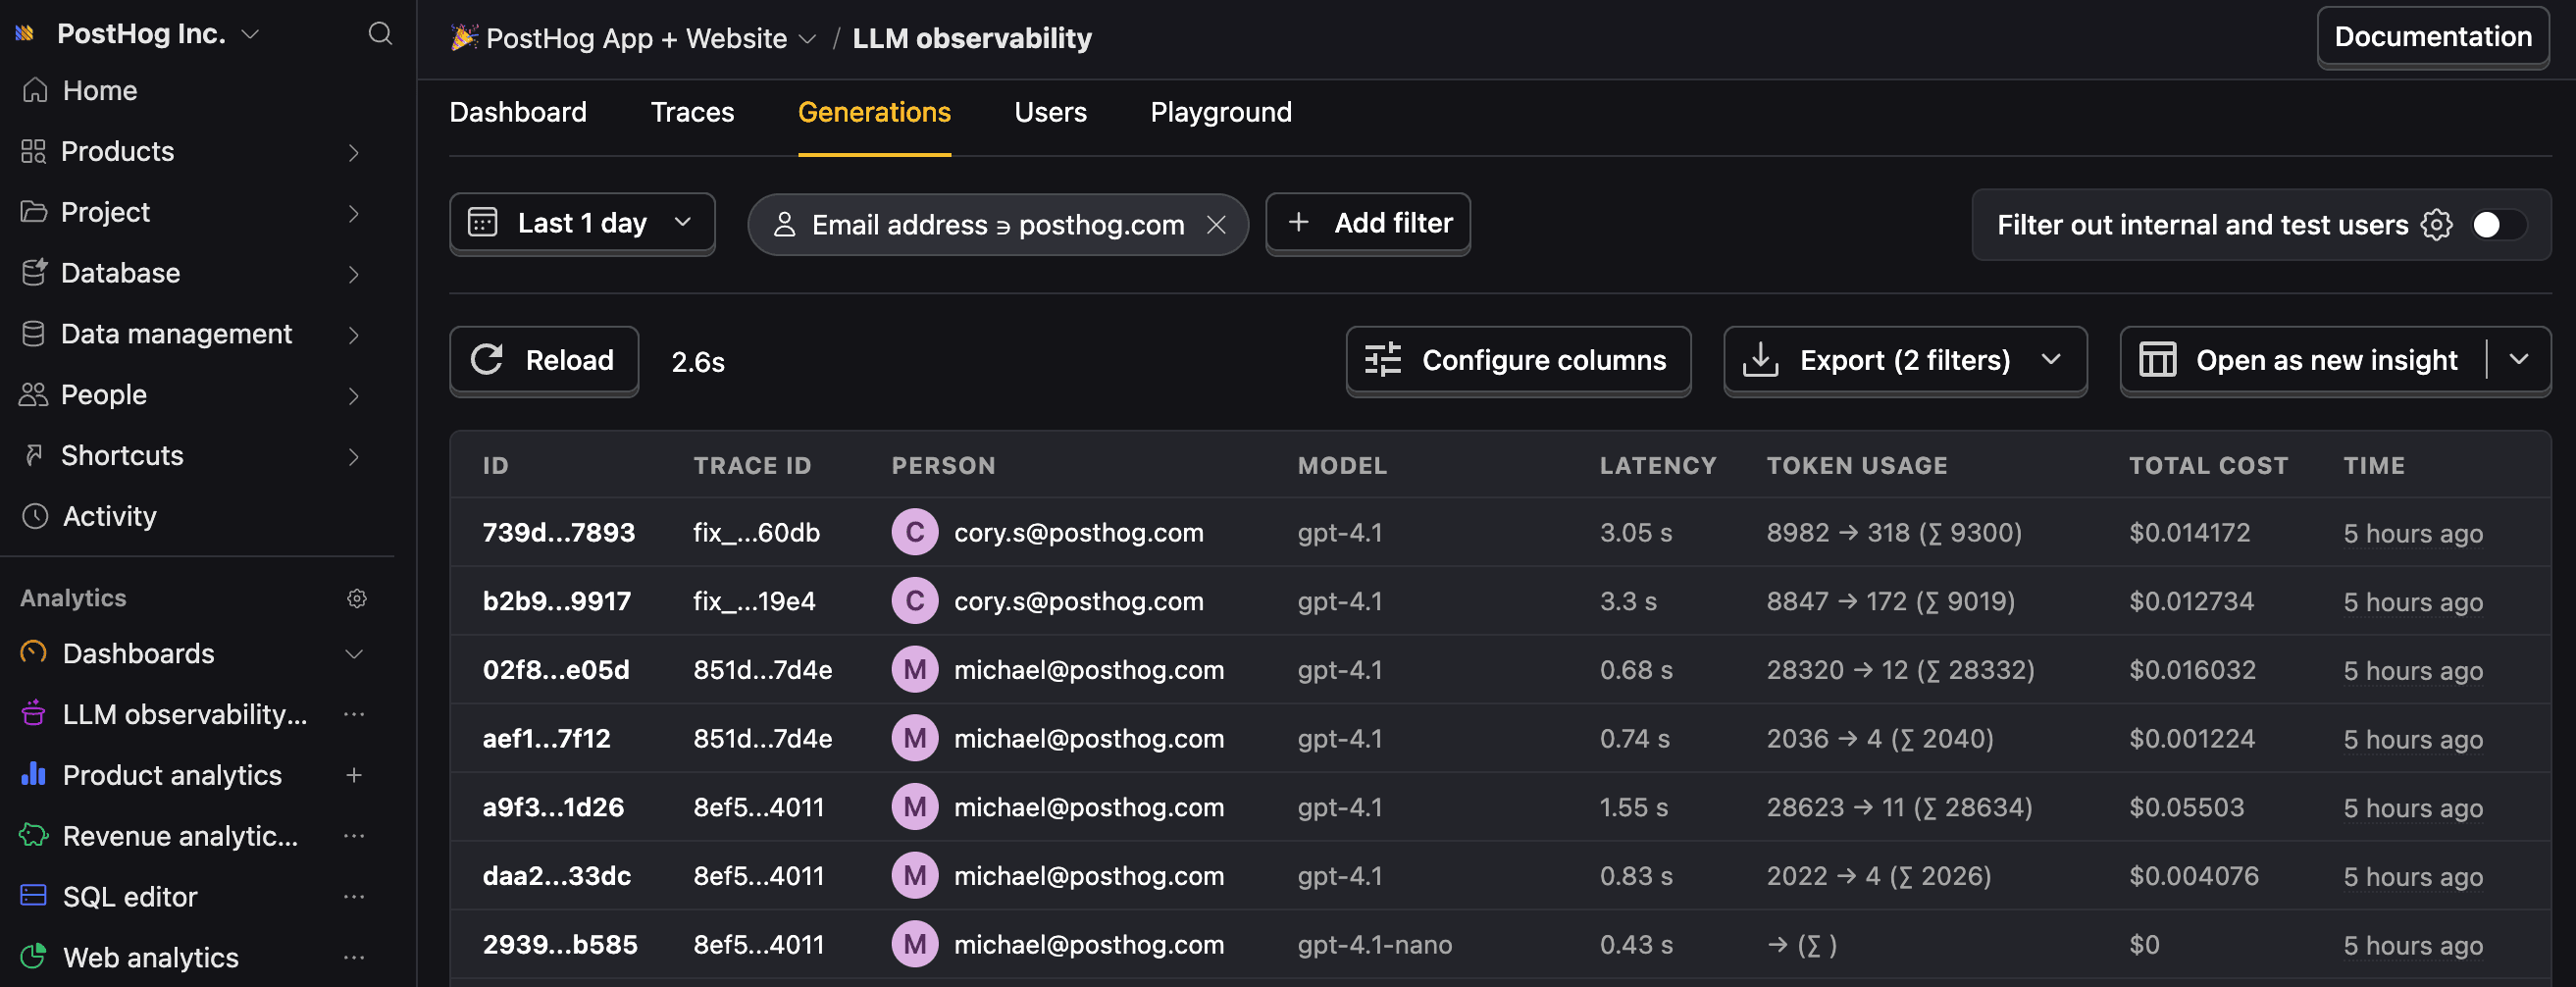
Resource Description Basics Learn the basics of how LLM calls become events in PostHog. Generations Read about the $ai_generationevent and its properties.Traces Explore the trace hierarchy and how to use it to debug LLM calls. Spans Review spans and their role in representing individual operations. Anaylze LLM performance Learn how to create dashboards to analyze LLM performance.